PakAlumni Worldwide: The Global Social Network
The Global Social Network
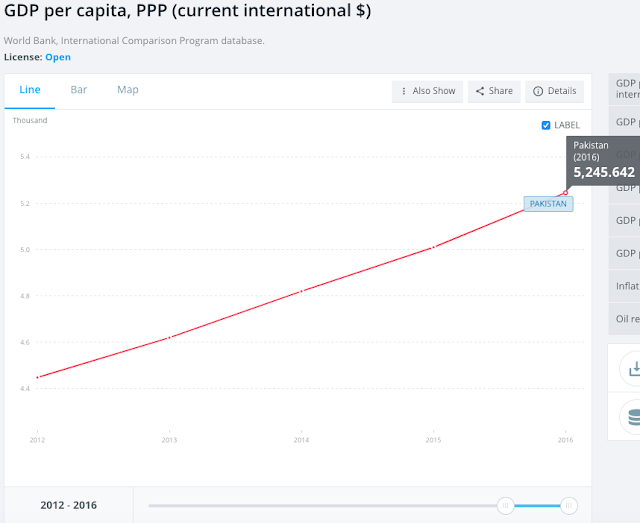
Per Capita Income in "Failed State" of Pakistan Up 22% in 2012-2017
Per capita income in Pakistan, often described as a "failed state", grew 22% from 2012 to 2017, according to data from international sources. This is remarkable given major security challenges and particularly bad press the country has had to deal with during this period. Also remarkable is the fact that the share of income of the poorest 20% has grown faster than other economies in Asia.
Per Capita Incomes in Large Economies:
China PPP per capita income grew the fastest at 48%, followed by India 43%, Turkey 32%, Indonesia 23%, Pakistan 22%, United Kingdom, United States and Japan 15%, Germany and Canada 13%, France 11%, Saudi Arabia 10%, Greece 9.5%, Russia and Italy 8%, Nigeria 7.5% and Brazil 0%.
In the 5 year period 2001 to 2006 prior to the outbreak of the current wave of terrorism, Pakistan per capita income grew 36%, much faster than the 22% in the last 5 years. This is indicative of Pakistan's potential for faster economic growth if the security situation continues to improve over the next 5 years.
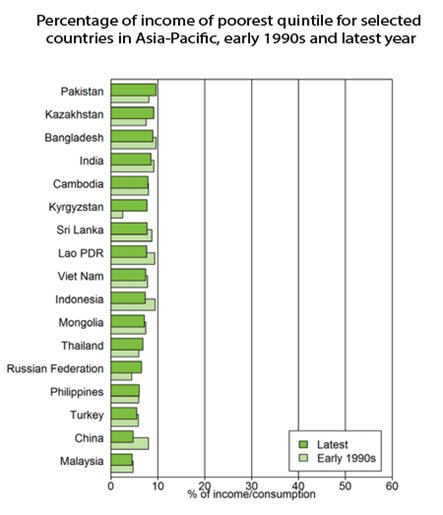
The share of national income of Pakistan's poorest 20% of households has increased from 8.1% to 9.6% since 1990 , according to the United Nations Economic and Social Commission for Asia and Pacific (NESCAP) Statistical Yearbook for 2015. It's the highest share of income for the bottom income quintile in the region.
Retail Sales Growth:
Rising incomes of Pakistanis are reflected in the retail sales growth which is ranked the fastest in the world. The market is forecast to expand 8.2% a year through 2016-2021 as disposable income has doubled since 2010, according to research group Euromonitor International as reported by Bloomberg News. The size of the middle class is estimated to surpass that of the U.K. and Italy in the forecast period, it said.
 |
| Retail Sales Growth. Source: Bloomberg |
Income Share Change in Asia's Poorest Quintile:
The countries where people in the poorest income quintile have increased their share of total income include Kyrgyzstan (from 2.5 per cent to 7.7), the Russian Federation (4.4 per cent to 6.5), Kazakhstan (7.5 per cent to 9.5) and Pakistan (8.1 per cent to 9.6). India's bottom income quintile has seen its share of income drop from 9% to 7.8%.
Bottom Quintile Income Share Change. Source: UNESCAP Statistical Ye... |
Although more people in China have lifted themselves out of poverty than any other country in the world, the poorest quintile in that country now accounts for a lower percentage of total income (4.7 per cent) than in the early 1990s (8.0 per cent). The same unfortunate trend is observed for a number of other countries, including in Indonesia (from 9.4 per cent to 7.6) and in the Lao People’s Democratic Republic (from 9.3 per cent to 7.6).
Credit Suisse Wealth Report 2017:
Data released by Credit Suisse with its Global Wealth Report 2017 shows that Pakistan is the most egalitarian nation in South Asia. It also confirms that the median wealth of Pakistani households is three times higher than that of households in India.
Here is per capita wealth data for India and Pakistan as of mid-2017, according to Credit Suisse Wealth Report 2017 released recently.
Pakistan average wealth per adult: $5,174 vs India $5,976
Pakistan median wealth per adult: $3,338 vs India $1,295
Average household wealth in Pakistan is $15,522 (3 adults) vs India $14,940 (2.5 adults)
Median household wealth in Pakistan is $10,014 (3 adults) vs India $3,237 (2.5 adults)
Pakistan Gini Index 52.6% vs India 83%
World Bank Update on Pakistan:
A November 2016 World Bank report says that Pakistan has successfully translated economic growth into the well-being of its poorest citizens. It says "Pakistan’s recent growth has been accompanied by a staggering fall in poverty".
Rising incomes of the poorest 20% in Pakistan since 2002 have enabled them to enhance their living standards by improving their diets and acquiring television sets, refrigerators, motorcycles, flush toilets, and better housing.
Another recent report titled "From Wealth to Well Being" by Boston Consulting Group (BCG) also found that Pakistan does better than India and China in translating GDP growth to citizens' well-being.
One particular metric BCG report uses is growth-to-well-being coefficient on which Pakistan scores 0.87, higher than India's 0.77 and China's 0.75.
Big Poverty Decline Since 2002:
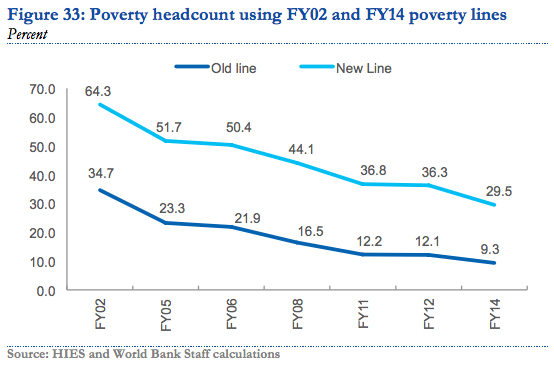
Using the old national poverty line of $1.90 (ICP 2011 PPP) , set in 2001, the percentage of people living in poverty fell from 34.7 percent in FY02 to 9.3 percent in FY14—a fall of more than 75 percent. Much of the socioeconomic progress reported by the World Bank since 2000 has occurred during President Musharraf's years in office from 2000-2007. It has dramatically slowed or stagnated since 2010.
Using the new 2016 poverty line of $3.50 (ICP 2011 PPP), 29.5 percent of Pakistanis as poor (using the latest available data from FY14). By back casting this line, the poverty rate in FY02 would have been about 64.3 percent.
Pakistan's new poverty line sets a minimum consumption threshold of Rs. 3,030 or $105 (ICP 2011 PPP) per person per month or $3.50 (ICP 2011 PPP) per person per day. This translates to between Rs. 18,000 and Rs. 21,000 per month for a household at the poverty line, allowing nearly 30% of the population or close to 60 million people to be targeted for pro-poor and inclusive development policies—thus setting a much higher bar for inclusive development.
Multi-dimensional Poverty Decline:
A UNDP report released in June 2016 said Pakistan’s MPI (Multi-dimensional poverty index) showed a strong decline, with national poverty rates falling from 55% to 39% from 2004 to 2015. MPI goes beyond just income poverty.
The Multidimensional Poverty Index uses a broader concept of poverty than income and wealth alone. It reflects the deprivations people experience with respect to health, education and standard of living, and is thus a more detailed way of understanding and alleviating poverty. Since its development by OPHI and UNDP in 2010, many countries, including Pakistan, have adopted this methodology as an official poverty estimate, complementing consumption or income-based poverty figures.
Rising Living Standards of the Poorest 20% in Pakistan:
According to the latest World Report titled "Pakistan Development Update: Making Growth Matter" released this month, Pakistan saw substantial gains in welfare, including the ownership of assets, the quality of housing and an increase in school enrollment, particularly for girls.
First, the ownership of relatively more expensive assets increased even among the poorest. In the bottom quintile, the ownership of motorcycles increased from 2 to 18 percent, televisions from 20 to 36 percent and refrigerators from 5 to 14 percent.
In contrast, there was a decline in the ownership of cheaper assets like bicycles and radios.
Housing quality in the bottom quintile also showed an improvement. The number of homes constructed with bricks or blocks increased while mud (katcha) homes decreased. Homes with a flush toilet almost doubled in the bottom quintile, from about 24 percent in FY02 to 49 percent in FY14.
Dietary Improvements for the Poorest 20% in Pakistan:
Decline in poverty led to an increase in dietary diversity for all income groups.
For the poorest, the share of expenditure devoted to milk and milk products, chicken, eggs and fish rose, as did the share devoted to vegetables and fruits.
In contrast, the share of cereals and pulses, which provide the cheapest calories, declined steadily between FY02 and FY14. Because foods like chicken, eggs, vegetables, fruits, and milk and milk products are more expensive than cereals and pulses, and have lower caloric content, this shift in consumption also increased the amount that people spent per calorie over time.
For the poorest quintile, expenditure per calorie increased by over 18 percent between FY02 and FY14. Overall, this analysis confirms that the decline in poverty exhibited by the 2001 poverty line is quite credible, and that Pakistan has done remarkably well overall in reducing monetary poverty based on the metric it set some 15 years ago, says the World Bank.
Summary:
Per capita income in Pakistan, often described as a "failed state", grew 22% from 2012 to 2017, according to data from international sources. This is remarkable given the particularly bad press the country has received during this period. Also remarkable is the fact that the share of income of the poorest 20% has also grown faster than other economies in Asia. In spite of the country's many challenges on multiple fronts, it has successfully translated its GDP growth into the well-being of its poorest citizens. The share of national income of Pakistan's poorest 20% of households has increased from 8.1% to 9.6% since 1990, according to the United Nations Economic and Social Commission for Asia and Pacific (NESCAP) Statistical Yearbook for 2015. It's the highest share of income for the bottom income quintile in the region. "Pakistan’s recent growth has been accompanied by a staggering fall in poverty", says a November 2016 World Bank report. An earlier report by Boston Consulting Group reached a similar conclusion.
Related Links:
Credit Suisse Wealth Report 2017
Pakistan Translates GDP Growth to Citizens' Well-being
-
Comment by Riaz Haq on January 2, 2018 at 9:26pm
-
#Pakistan #business people mostly upbeat on #economy in 2018. #CPEC
http://www.gulf-times.com/story/576700/Pakistan-business-people-mos...
Politics is likely to weigh heavily on investment decisions of companies and businessmen in 2018 in Pakistan because of worsening political strife and threat of protests by certain opposition parties and religious groups ahead of the upcoming elections. However, economic analysts and business people say economic growth prospects proffered by improved energy supplies and security conditions, as well as new business opportunities opening up under the multibillion-dollar China-Pakistan Economic Corridor (CPEC) initiative will keep new investments coming in despite political uncertainty.
----------
Politics is likely to weigh heavily on investment decisions of companies and businessmen in 2018 in Pakistan because of worsening political strife and threat of protests by certain opposition parties and religious groups ahead of the upcoming elections.
However, economic analysts and businesspeople say economic growth prospects proffered by improved energy supplies and security conditions, as well as new business opportunities opening up under the multibillion-dollar China-Pakistan Economic Corridor (CPEC) initiative will keep new investments coming in despite political uncertainty.
“Despite concerns, the industry believes the political situation will improve and uncertainty will ease in the next several months the government will complete its term and the elections will be held on time,” argues Saad Hashemy, chief economist and director research at Topline Securities.
This means investors will largely start returning to the market and companies will begin implementing their expansion plans as the country moves towards the new elections.
Syed Nabeel Hashmi, a leading auto parts manufacturer and exporter, agrees. “Indeed, political changes do affect investment decisions because businesses like stability. But I think the lull in investment in the first half of 2018 is not going to break the growth momentum,” he says.
“I think the elections are going to generate a lot of economic activity, and create new business opportunities and jobs. Unless there is widespread political disturbance and violence, I see the economy and private business grow pretty fast in 2018, despite it being an election year,” he says.
Triggered by disqualification of ex-prime minister Nawaz Sharif by the apex court in a corruption inquiry linked to the leaked Panama Papers, concerns about the premature dismissal of the PML-N government and possible delays in the next polls had deepened.
This was because of the two-week-long lockdown by a religious group on changes in the oath of elected public representatives and the last-minute refusal of PPP and PTI to support the delimitation bill.
Ever since, the protest sit-in has been called off, the delimitation law passed and fears about future of government dissipated.
Even if the country’s exports have slowed down and fallen by almost a quarter in the last three years, Hashmi feels that domestic demand continues to rise rapidly.
“From auto, steel and cement to food, white goods and pharmaceuticals, you know, there is double-digit growth everywhere,” he says. “Our GDP is growing by almost 7.5%-8% due to increasing domestic demand if we also take our large undocumented economy into account.
No domestic market-based investor or company focused on consumer market can ignore this trend and stop investing in capacity enhancement, no matter what the political conditions in the country are.”
Quratul Ain Irfan, vice president of a pharmaceutical company, says the overall economic outlook for 2018 looks promising, with the CPEC taking shape and reduction in energy shortages.
“Pakistan’s economic outlook is quite bright. Cement, steel, chemicals, food, pharmaceuticals and consumer durables should do well despite election-related political activities,” she says.
-
Comment by Riaz Haq on January 2, 2018 at 9:29pm
-
Fresh
#Investments in#India plunge to a 13-year low as stalled projects rise - Livemint.#Modi#BJP#economyNew project announcements by Indian companies touched a 13-year low of Rs77,000 crore in the December quarter, the project-tracking database of the Centre for Monitoring Indian Economy (CMIE) shows.
The latest numbers suggest that the investment cycle in India is unlikely to witness a turnaround anytime soon. This means that it may take longer than expected for India’s growth engine to roar back to life. CMIE’s capital expenditure database is the most widely tracked one in India, and the data on new project announcements serves as a lead indicator for the economy.
The data shows that the value of new projects more than halved in the December quarter compared to the year-ago period. Compared to the preceding quarter, the three months ended December saw a 33% decline in the value of new project announcements. The last time project announcements reached such a low was in 2004.
The manufacturing sector has seen the sharpest fall in new project announcements. The only silver lining in the data was a sharp uptick in power projects, thanks largely to a Rs1,000 crore renewable power project in Andhra Pradesh and a Rs9,000 crore gas-based power project in Punjab.
Overall though, the investment picture remains bleak. There are three key reasons for the sluggish investment scenario. One reason is the low level of capacity utilization at existing plants. The last round of the Order Books, Inventories and Capacity Utilisation Survey (OBICUS) showed that capacity utilization had declined by more than three percentage points to 71.2% in the June quarter compared to the preceding quarter. The second reason for the lack of fresh investments was the pile-up of bad loans, which has made banks wary of lending, and has made companies cautious about new projects. The third and related reason is the rise in stalled projects, which has acted as a fetter on the animal spirits of Indian industry.
Indeed, the latest data from CMIE shows that the stalling rate for private sector projects has reached a record high at 24.7% in the December quarter. This beats the previous peak of 23.8% in December 2003.
The stalling rate is calculated as a percentage of the total projects under implementation so that the values are comparable across time. The stalling rates in government projects have seen a sharp improvement. But owing to the deterioration in the stalling rate of private sector projects, the overall stalling rate is hovering near a record-high at 13.2%.
The biggest reasons for stalling are lack of clearances (environmental clearances and others). The other key reasons are problems with fuel and raw materials, land acquisition problems, and lack of funds.
The manufacturing and power sectors are the worst affected by stalling. The power sector accounted for 40.6% of all stalled projects while manufacturing accounted for 28.4%of such projects.
Unless the pipeline of stalled projects gets cleared quickly and the debt resolution process moves faster, the capex cycle is unlikely to see a quick recovery.
Comment
Twitter Feed
Live Traffic Feed
Sponsored Links
South Asia Investor Review
Investor Information Blog
Haq's Musings
Riaz Haq's Current Affairs Blog
Please Bookmark This Page!
Blog Posts
IMF Questions Modi's GDP Data: Is India's Economy Half the Size of the Official Claim?
The Indian government reported faster-than-expected GDP growth of 8.2% for the September quarter. It came as a surprise to many economists who were expecting a slowdown based on the recent high-frequency indicators such as consumer goods sales and durable goods production, as well as two-wheeler sales. At the same time, The International Monetary Fund expressed doubts about the Indian government's GDP data. …
ContinuePosted by Riaz Haq on November 30, 2025 at 11:30am
Retail Investor Growth Driving Pakistan's Bull Market
Pakistan's benchmark index KSE-100 has soared nearly 40% so far in 2025, becoming Asia's best performing market, thanks largely to phenomenal growth of retail investors. About 36,000 new trading accounts in the South Asian country were opened in the September quarter, compared to 23,600 new registrations just three months ago, according to Topline Securities, a brokerage house in Pakistan. Broad and deep participation in capital markets is essential for economic growth and wealth…
ContinuePosted by Riaz Haq on November 24, 2025 at 2:05pm
© 2025 Created by Riaz Haq.
Powered by
![]()


You need to be a member of PakAlumni Worldwide: The Global Social Network to add comments!
Join PakAlumni Worldwide: The Global Social Network